ACM11 Homework 4 Solutions
Contents
Problem 1(a)
Write a function that converts the row and column of a keypad entry to the corresponding number. See freq2num.html. We can test it:
fprintf('The entries of the keypad look like:\n');
for k = 1:4
    for j = 1:3
        fprintf('%s ', freq2num(k,j) );
    end
    fprintf('\n');
end
The entries of the keypad look like:
1 2 3
4 5 6
7 8 9
* 0 #
Problem 1(b)
Load the data and put it in a useable form
fr = [697 770 852 941];     % row frequencies, in Hz
fc = [1209 1336 1477];      % column frequencies, in Hz

%   See what variables are in the file:
who -file touchtone.mat
%   We could load all variables with this line:
% load touchtone
%   Or, just load variable "y":
load touchtone y
%   Extract the data:
Fs = y.fs;
Y = double(y.sig)/128;      % convert to a floating point number
n = length(Y);
t = (0:(n-1) ) / Fs;

% plot(t,Y)                 % plots the signal in the time-domain
% sound(Y,Fs)               % plays the sound on speakers

% break Y up into pieces:
% use data cursor to make the index "by hand"
indx = [0,.6,1.5,2.1,2.8,3.5,4.1,4.8,5.5,6.1,6.8,7.4]*1e4 + 1;
for chunk = 1:11
    Time{chunk} = t(indx(chunk):indx(chunk+1));
    Sig{chunk} = Y(indx(chunk):indx(chunk+1));
end
Your variables are:

D  y  z
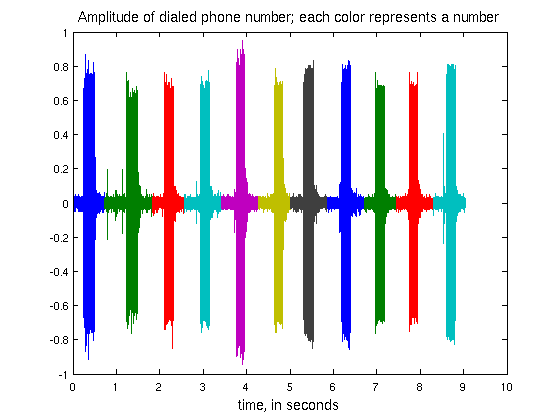
make a plot:
for chunk = 1:11, plot(Time{chunk},Sig{chunk} ); hold all; end
title('Amplitude of dialed phone number; each color represents a number',...
    'fontsize',12);
xlabel('time, in seconds','fontsize',12);
Problem 1(c)
Number = [];
for chunk = 1:11        % loop through each number separately
    [P,F] = pwelch(Sig{chunk},[],[],[],Fs);     % take fourier transform
    f = F( find( P > .3*1e-3 ) );               % find dominant frequencies

    % we want to combine neighboring frequencies.  Here's one method:
    tones = f(1);
    for fi = f(2:end).'
        % all frequencies within 50 Hz are lumped together.  This is OK
        % because the touch-tone frequencies (in fr and fc) are all
        % separated by at least 70 Hz.
        if abs(fi - tones(end)) > 50
            tones = [tones, fi];
        end
    end
    if length(tones) ~= 2
        disp('error! found more than two tones (or less)');
    end

    % because the row frequencies (fr) are always less than the column
    % frequencies (fc), we know tones(1) is a row frequency and tones(2)
    % is a column frequency.  Now, we look for the best match:
    x = abs( fr - tones(1) );
    [temp,i] = min(x);      % "temp" is the max, and "i" is the index
                            %  where the max occurred
    tone1 = fr(i);
    % repeat for column frequency now:
    x = abs( fc - tones(2) );
    [temp,j] = min(x);
    tone2 = fc(j);
    % call our function from part (a) to get the number:
    Number = [Number, freq2num(i,j)] ;
end
fprintf('Dialed phone number is %s-%s-%s-%s\n',Number(1),...
    Number(2:4),Number(5:7),Number(8:end));
Dialed phone number is 1-508-647-7001
The problem further asked for a function that takes a signal as input and returns the phone number. Modifying the above to a function is straightforward.
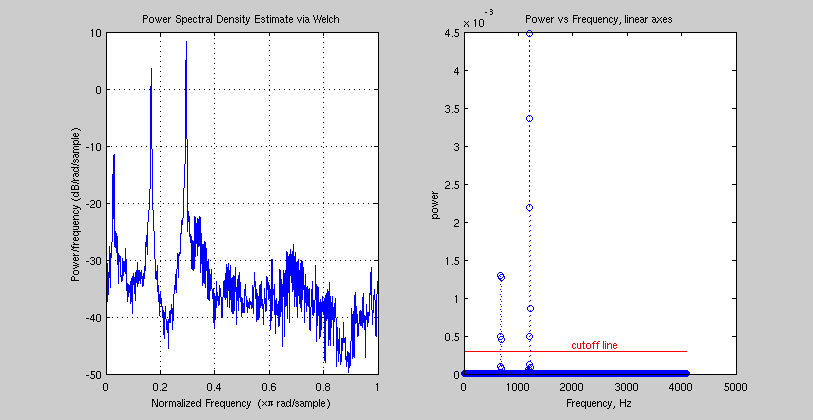
Here are some plots of what's happening (for a single chunk)
[P,F] = pwelch(Sig{chunk},[],[],[],Fs);     % take fourier transform
f = F( find( P > .3*1e-3 ) );               % find dominant frequencies
% make a plot, to show what's going on
figure(1); subplot(1,2,1);
pwelch( Sig{1},[],[],Fs);
subplot(1,2,2);
plot( F, P, 'o:' ); title('Power vs Frequency, linear axes');
xlabel('Frequency, Hz'); ylabel('power');
line( [F(1),F(end)],.3e-3*[1,1],'color','red');
text( 2000, .4e-3,'cutoff line','color','red');
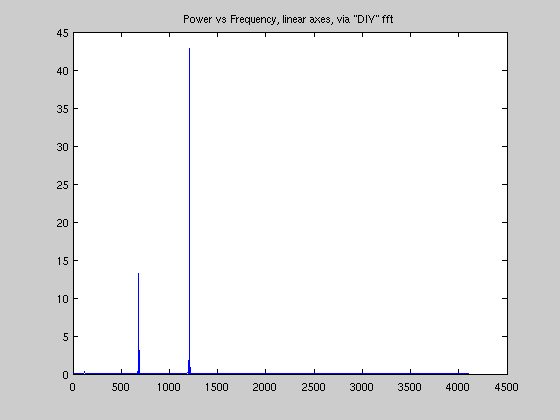
if we wanted to do a Fourier Transform (i.e. w/o pwelch), here's how:
l = length( Sig{1} );
p = fft( Sig{1} )/sqrt(l);
p = abs( p(1: round(l/2)+1 ) ).^2; % only take part of the output
% because for a Real input, the fft
% had redundancies.  Take the
% square to convert to power.
% Here's the appropriate scaling for frequency:
F2 = (0:round(l/2) )* Fs/l;
figure(2);
plot(F2,p);
title('Power vs Frequency, linear axes, via "DIY" fft');