

Semester: Autumn 2021
Classroom: virtual
Time: MWF 3:00-3:50pm
Main Website
Instructor: Dr. Vanja Dukic
office Hours: MW 5-6:15pm, virtual
Course Assistant: Ruyu Tan,
Office Hours: Tue/Wed/Thu 9am-10am, virtual
Department of Applied Mathematics
University of Colorado-Boulder
Statistical Methods
Homework 5:
Note 1: Homeworks are due at the beginning of the "due date" class. Late hw will not be accepted, except in extraordinary circumstances.
Note 2: If you can't solve some of the problems, please come to the office
hours, or email us a very specific and short question. Email will not work well or at all for
involved or unclear questions.
For this homework, please complete the following problems:
- Problem 1
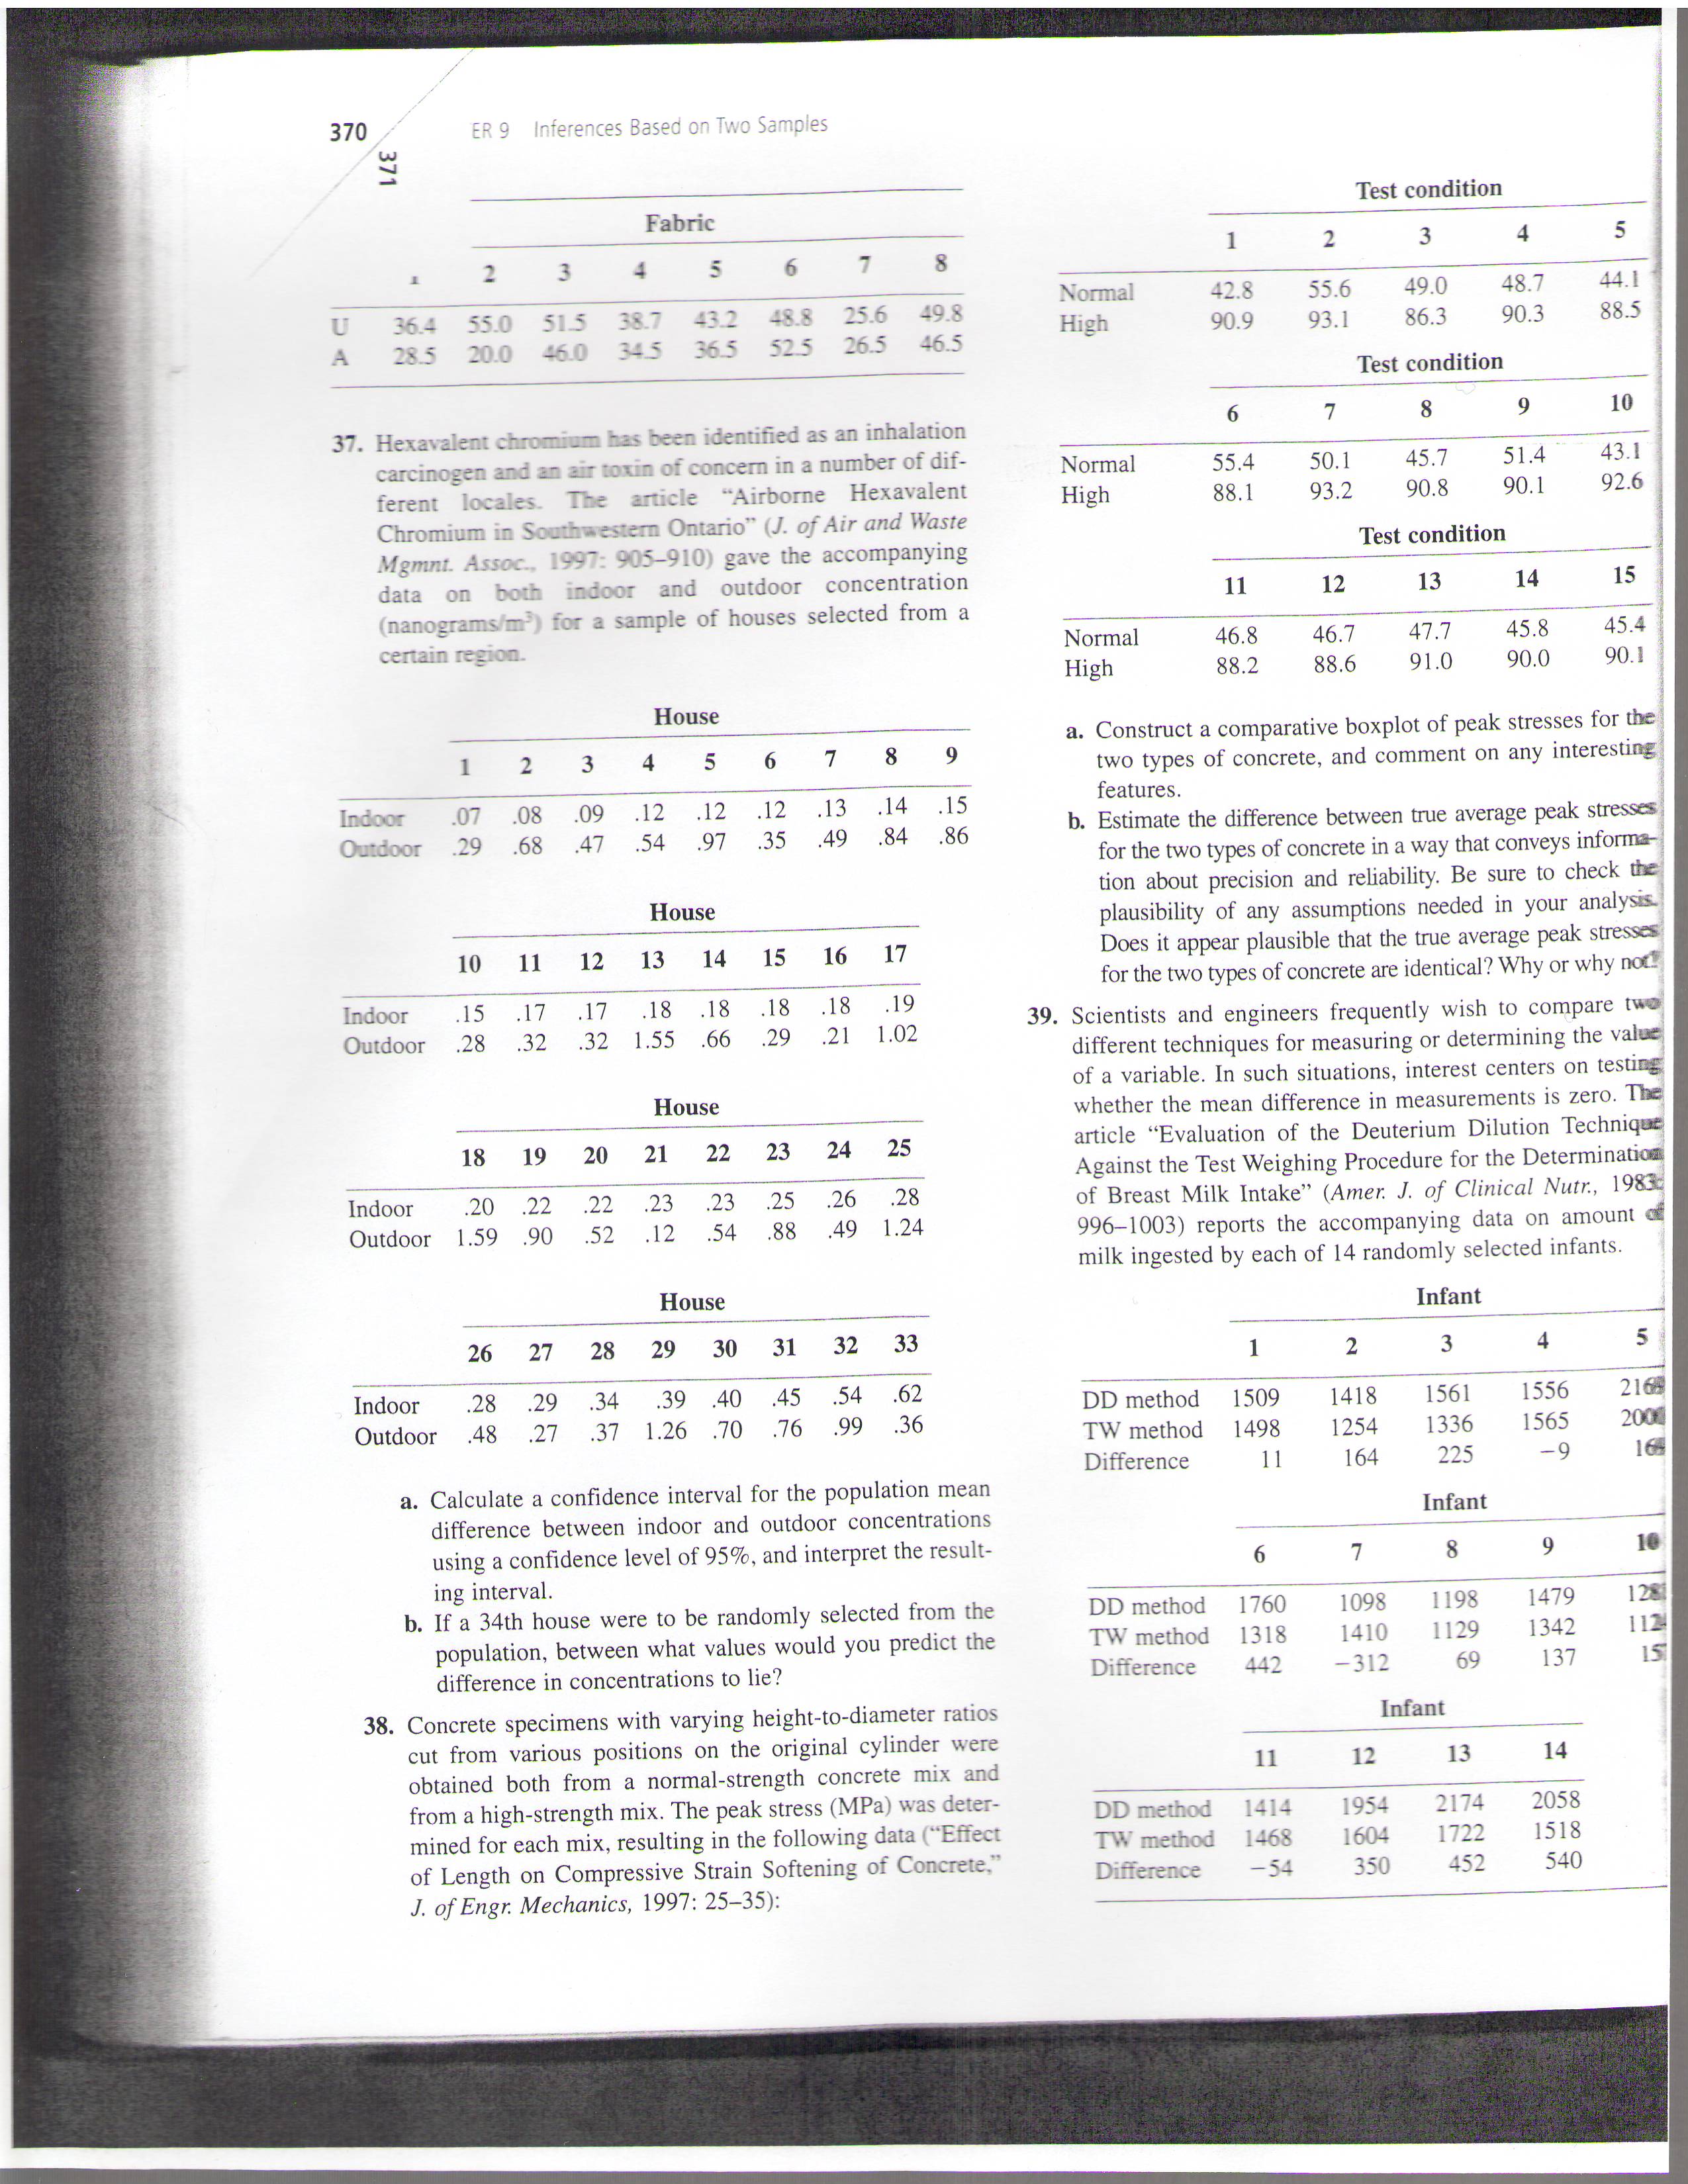
Please do problem #37 in here). In addition to answering the parts (a) and (b), answer the following:
c) Construct the 95% confidence intervals for the indoor and for the outdoor true concentration. d) Do these CIs overlap? Can you use that fact to test the hypothesis test that the two means are equal? Why or why not? Write a paragraph justifying your answer. To help you think through this answer, use the following short paper
- Problem 2
Back to ladybugs -- recall that aphid infestation of fruit trees is usually controlled either via pesticides or via ladybug innundation. In a particular area, 2 different (and well isolated) groves, with 15 fruit trees each, are selected for an experiment. The trees in both groves are of the same age, roughly the same size, and can be assumed to be independent. One grove is sprayed with pesticides, and one is flooded with ladybugs. The fruit yield (in pounds) for each tree is given below:
Pesticide trees:
55.57109 36.50319 47.80090 33.34822 36.16251
35.28337 41.50154 44.18931 40.81439 33.88648
44.90427 49.97089 22.85414 27.84301 38.49843
Ladybug trees:
45.44505 35.52320 46.97865 45.76921 41.66216
54.69599 58.77678 49.08538 48.53812 70.17137
51.86253 39.59365 42.10194 47.39945 39.04648
a) Test to see if each of these two samples come from a normal distribution (need not be the same normal distribution). Use significance level of 5%.
b) Find the sample means of yields for the two groves, and provide the two 95% confidence intervals for the true mean yields for trees under the two treatments.
c) Find the sample variances for the yields in the two groves.
d) Test the equality of these two variances using significance level of 5%. (Write out the hypotheses, compute the test statistic, p-value, and write out the conclusion)
e) Test the equality of the two mean yields. (Write out the hypotheses, compute the test statistic, p-value, and write out the conclusion)
- Problem 3
A controlled clinical trial was run to investigate the effect of the drug stelazine on chronic schizophrenics. The trials were conducted on chronic schizophrenics in two closed wards. In each of the wards, the patients were divided into two groups matched for age, length of time in the hospital, and disease severity as measured by a behavior rating score. One member of each pair was given stelazine, and the other a placebo. Only the hospital pharmacist knew which member of each pair received the actual drug.
The data is given in the spreadsheet and shows, for each of the patients, the change in the patient's behavioral rating score after 3 months. Positive values indicate an improvement in the patient's behavior over the three month period, while negative values indicate that the patient's behavior declined. The table also shows the difference between the stelazine patient's change and placebo patient's change for each of the patient pairs.
Use appropriate hypothesis tests to answer the following two questions, being sure to complete each of the four steps:
i. state the two hypotheses being tested (be sure to define any parameters used, if they were not defined previously),
ii. compute the appropriate test statistic, degrees of freedom (if applicable), and p-value,
iii. decide whether to reject the null hypothesis when using a significance level of 0.05, and
iv. conclude by writing a short sentence explaining what your decision means in the context of the problem.
a. Considering all patients, test whether the average behavioral change is higher for patients using stelazine than for patients receiving a placebo (thus indicating that stelazine improves chronic schizophrenic behavior).
b. Using the differences, S-P, test whether stelazine is more effective, on average, in one of the wards than in the other. Carry out the appropriate test for the equality of variances if necessary. Were we right to combine all patients for our answer in (a)?
- Problem 4
A study performed in a Boston area high school showed a link between drinking soda and weak bones. Among 57 active children who do not drink soda, 5 suffered fractures. Among 107 active children who reported drinking soda, 38 suffered fractures. The study did not specify how much soda the children drank. (The Denver Post, 6/15/2000, "New study links cola, weak bones.")
a. Using a two-sample test of proportions, determine whether this study provides significant evidence at the 1% level to suggest that the probability of getting a fracture is lower for kids that do not drink soda than it is for kids that do drink soda.
b. Construct a 99% confidence interval for the difference in the probabilities of getting a fracture for non-cola drinking and cola drinking kids. In one or two sentences, interpret this interval for someone who has never taken a statistics course.